VictoriaMetrics is a fantastic alternative to prometheus, especially in a home lab where resources are constrained. It’s several times more efficient with its RAM usage while being pretty much fully PromQL compatible (with a few nice extras, too).
One of the nice features of VM are retention filters, allowing to set up different retentions for different metrics (this feature is available only in the enterprise version, though). This allows longer retention for important historical data like the average HDD temperature over the last 5 years vs. dropping the very exciting and very useless (most of the time) kubelet metrics within days.
Unfortunately, the retention filters don’t clean up the indexdb until the primary retention period kicks in, and that one would be the largest retention period in your VM instance (i.e. the filters can only decrease it), meaning that for a retentionPeriod of 5 years, your indexdb will never be compacted (and it tends to grow pretty unconstrained).
A relatively easy solution to that is to configure the vmagent to send metrics to two VM storage clusters (the architecture scales horizontally really well) based on the labels, and then have one vmselect selecting data from both clusters so that the consumers (grafana) have no idea what’s happening.
Lets set up the clusters first. It’s pretty trivial with the operator, I just had to copy and paste the relevant CRDs and move the vmselect component into its own dedicated cluster:
  1
  2
  3
  4
  5
  6
  7
  8
  9
 10
 11
 12
 13
 14
 15
 16
 17
 18
 19
 20
 21
 22
 23
 24
 25
 26
 27
 28
 29
 30
 31
 32
 33
 34
 35
 36
 37
 38
 39
 40
 41
 42
 43
 44
 45
 46
 47
 48
 49
 50
 51
 52
 53
 54
 55
 56
 57
 58
 59
 60
 61
 62
 63
 64
 65
 66
 67
 68
 69
 70
 71
 72
 73
 74
 75
 76
 77
 78
 79
 80
 81
 82
 83
 84
 85
 86
 87
 88
 89
 90
 91
 92
 93
 94
 95
 96
 97
 98
 99
100
101
102
103
104
105
106
107
108
109
110
111
112
113
114
115
116
117
118
119
120
121
122
123
124
125
126
127
128
129
130
131
132
133
134
135
136
137
138
139
140
141
142
143
144
145
146
147
148
149
150
151
152
153
154
155
156
157
158
159
160
161
162
163
164
165
166
|
### THIS IS THE SHORT-TERM CLUSTER
---
apiVersion: operator.victoriametrics.com/v1beta1
kind: VMCluster
metadata:
  name: short
spec:
  retentionPeriod: "1" # month
  ### IT HAS ONE STORAGE
  vmstorage:
    image:
      tag: v1.101.0-enterprise-cluster
    replicaCount: 1
    storage:
      volumeClaimTemplate:
        spec:
          accessModes: [ReadWriteOnce]
          resources:
            requests:
              storage: 50Gi
          storageClassName: manual
          volumeName: victoriametrics-short-data
    extraArgs:
      eula: "1"
      enableTCP6: "true"
      licenseFile: "/license/license.txt"
    volumes:
      - name: license
        secret:
          secretName: license
    volumeMounts:
      - name: license
        readOnly: true
        mountPath: "/license"
  ### AND ONE INSERT
  vminsert:
    image:
      tag: v1.101.0-enterprise-cluster
    replicaCount: 1
    extraArgs:
      maxLabelsPerTimeseries: "35"
      eula: "1"
      enableTCP6: "true"
      licenseFile: "/license/license.txt"
    volumes:
      - name: license
        secret:
          secretName: license
    volumeMounts:
      - name: license
        readOnly: true
        mountPath: "/license"
---
apiVersion: v1
kind: PersistentVolume
metadata:
  name: victoriametrics-short-data
spec:
  storageClassName: manual
  capacity:
    storage: 50Gi
  accessModes: [ReadWriteOnce]
  persistentVolumeReclaimPolicy: Retain
  hostPath:
    path: "/kube/victoriametrics-short-data"

### THIS IS THE LONG TERM CLUSTER
---
apiVersion: operator.victoriametrics.com/v1beta1
kind: VMCluster
metadata:
  name: long
spec:
  ### MUCH HIGHER RETENTION
  retentionPeriod: "5y"
  vmstorage:
    image:
      tag: v1.101.0-enterprise-cluster
    replicaCount: 1
    storage:
      volumeClaimTemplate:
        spec:
          accessModes: [ReadWriteOnce]
          resources:
            requests:
              storage: 50Gi
          storageClassName: manual
          volumeName: victoriametrics-long-data
    extraArgs:
      eula: "1"
      enableTCP6: "true"
      ### AND DOWNSAMPLING APPLIED
      downsampling.period: 30d:5m,180d:1h,1y:6h,2y:1d
      licenseFile: "/license/license.txt"
    volumes:
      - name: license
        secret:
          secretName: license
    volumeMounts:
      - name: license
        readOnly: true
        mountPath: "/license"
  vminsert:
    image:
      tag: v1.101.0-enterprise-cluster
    replicaCount: 1
    # TODO: Authenticate the API
    extraArgs:
      maxLabelsPerTimeseries: "35"
      eula: "1"
      enableTCP6: "true"
      licenseFile: "/license/license.txt"
    volumes:
      - name: license
        secret:
          secretName: license
    volumeMounts:
      - name: license
        readOnly: true
        mountPath: "/license"
---
apiVersion: v1
kind: PersistentVolume
metadata:
  name: victoriametrics-long-data
spec:
  storageClassName: manual
  capacity:
    storage: 50Gi
  accessModes: [ReadWriteOnce]
  persistentVolumeReclaimPolicy: Retain
  hostPath:
    path: "/kube/victoriametrics-long-data"

### THIS IS A SELECT-ONLY CLUSTER
---
apiVersion: operator.victoriametrics.com/v1beta1
kind: VMCluster
metadata:
  name: select
spec:
  retentionPeriod: "1" # unused
  vmselect:
    image:
      tag: v1.101.0-enterprise-cluster
    replicaCount: 1
    extraArgs:
      eula: "1"
      enableTCP6: "true"
      ### THAT IS POINTED TO BOTH STORAGES
      storageNode: "vmstorage-short:8401,vmstorage-long:8401"
      downsampling.period: 30d:5m,180d:1h,1y:6h,2y:1d
      licenseFile: "/license/license.txt"
    volumes:
      - name: search-results
        emptyDir:
          sizeLimit: 500Mi
      - name: license
        secret:
          secretName: license
    volumeMounts:
      - name: search-results
        mountPath: /tmp
      - name: license
        readOnly: true
        mountPath: "/license"
|
Now, let’s tell vmagent to send labels to different clusters based on the name. To do that, you need to make an extra relabel config per remote write URL. In my case, I have this as my long.yaml:
1
2
3
4
5
6
7
|
- action: keep
  regex:
  - node_hwmon_temp_celsius
  - node_hwmon_sensor_label
  - smartctl_device_temperature
  source_labels:
  - __name__
|
and its inversion for short.yaml:
1
2
3
4
5
6
7
|
- action: drop
  regex:
  - node_hwmon_temp_celsius
  - node_hwmon_sensor_label
  - smartctl_device_temperature
  source_labels:
  - __name__
|
By default, vmagent will happily write metrics to all the remote endpoints, but in my case there’s no need to store them twice. Also, note the nice regex: [...] syntax that’s not available in prometheus!
To apply the configs, you need to match every -remoteWrite.url flag with a -remoteWrite.urlRelabelConfig flag. The config will be applied to the preceding url. If there are less configs than urls, the final ones won’t have any extra relabelling done. My nix config looks like this in the end:
 1
 2
 3
 4
 5
 6
 7
 8
 9
10
11
12
13
14
15
16
17
18
19
20
21
22
23
24
25
26
27
28
29
30
31
32
33
34
35
|
services.vmagent =
  let
    format = pkgs.formats.yaml { };
    longMetrics = [
      "node_hwmon_temp_celsius"
      "node_hwmon_sensor_label"
      "smartctl_device_temperature"
    ];
    relabelShort = [
      {
        action = "drop";
        source_labels = [ "__name__" ];
        regex = longMetrics;
      }
    ];
    relabelLong = [
      {
        action = "keep";
        source_labels = [ "__name__" ];
        regex = longMetrics;
      }
    ];
    relabelShortConfig = format.generate "short.yml" relabelShort;
    relabelLongConfig = format.generate "long.yml" relabelLong;
  in
  {
    enable = true;
    extraArgs = [
      "-remoteWrite.url=http://${shortURL}/insert/0/prometheus/api/v1/write"
      "-remoteWrite.urlRelabelConfig=${relabelLongConfig}"
      "-remoteWrite.url=http://${longURL}/insert/0/prometheus/api/v1/write"
      "-remoteWrite.urlRelabelConfig=${relabelShortConfig}"
      "-remoteWrite.tmpDataPath=%C/vmagent/remote_write_tmp"
    ];
  };
|
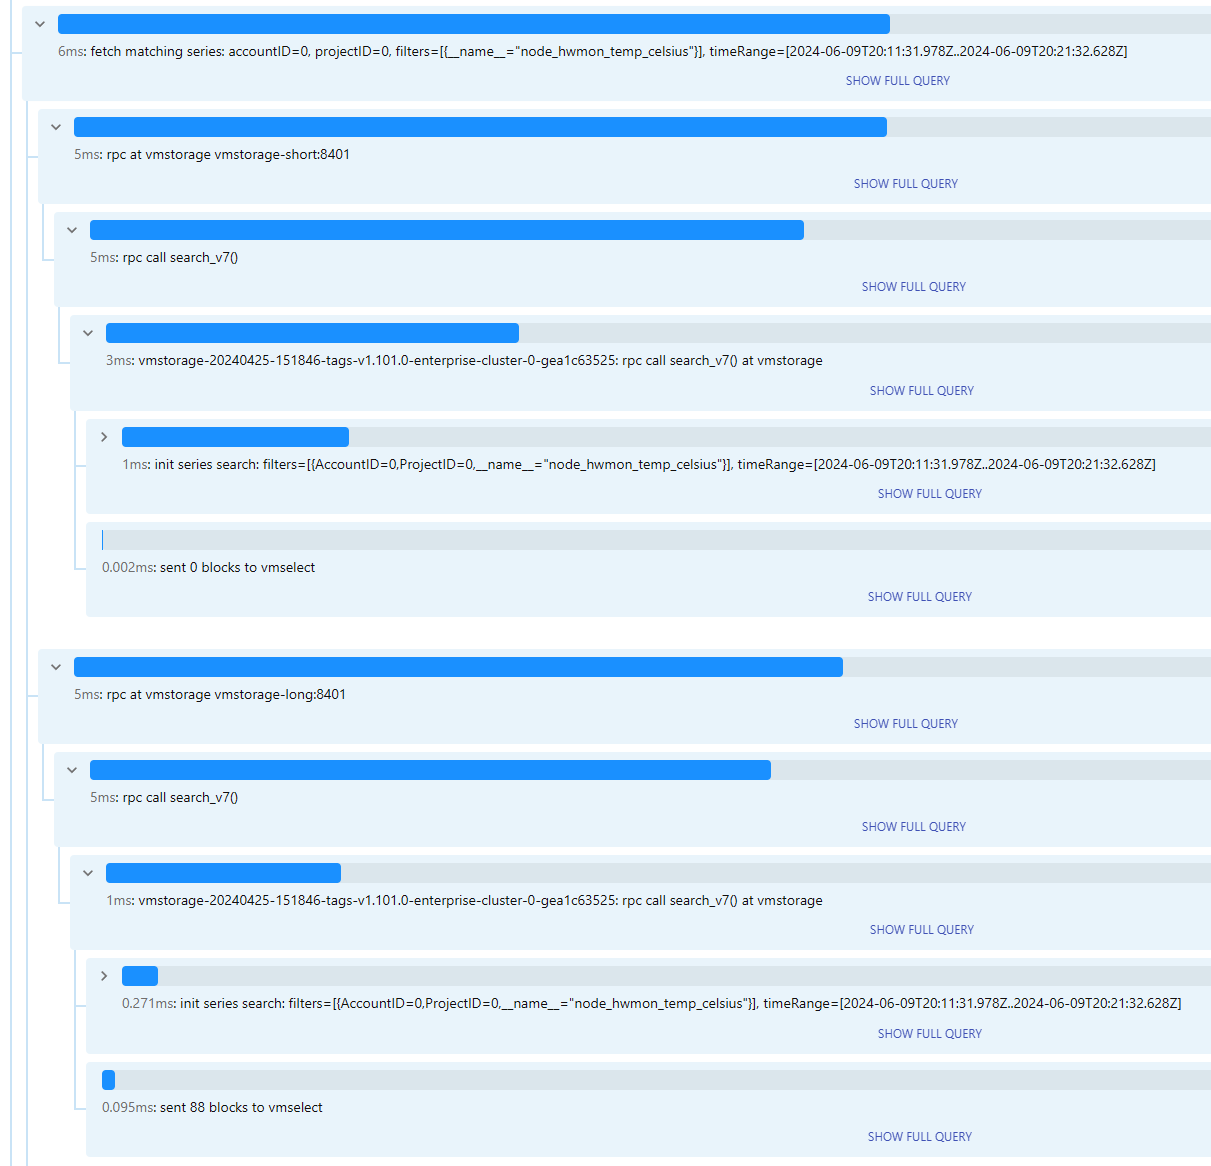
To verify that it’s working as intended, navigate to the vmselect instance and run a query for the metric that should be passed to the other instance. VMselect has built-in tracing capabilities:

that demonstrate all the blocks are coming from vmstorage-long:

Huge thanks to the VM team for creating a superb product and for allowing me to use the enterprise edition in my homelab setup.

