I run the node_exporter on my NAS and I’m generally curious about the temperatures inside. There’s a metric called node_hwmon_temp_celsius—it exports the temperature measurements of all the sensors you have, but it has a bit of hard to digest set of labels:
node_hwmon_temp_celsius{chip="platform_nct6775_656", sensor="temp1"} 35
node_hwmon_temp_celsius{chip="platform_nct6775_656", sensor="temp10"} 21
...
Wouldn’t it be nice if instead of tempXX you had something more human-readable? Luckily, there’s a metric for it, too:
node_hwmon_sensor_label{chip="platform_nct6775_656", label="SYSTIN", sensor="temp1"} 1
node_hwmon_sensor_label{chip="platform_nct6775_656", label="PCH_CHIP_TEMP", sensor="temp10"} 1
...
The actual values of that metric are always 1, so the only thing I care for is the label label. But how do I get that label into the node_hwmon_temp_celsius metric?
I tried to tinker with Grafana’s data transformations, but they seemed overly complicated and wouldn’t do exactly what I needed. Luckily, mastodon is full of good people. @meeroagh@mastodon.ie and @kfekete@hachyderm.io reminded me this problem is solvable in pure promql!
The answer to it is vector matching:
node_hwmon_temp_celsius
 /
 on(job, chip, sensor)
 group_left(label)
 (node_hwmon_sensor_label)
we take the values of node_hwmon_temp_celsius (1), and group it (4) with the additional label of label from node_hwmon_sensor_label (5) using the job, chip, and sensor (3) as the labels to group on. As you can only do vector matching on bin-ops, we also divide (2) the value of temp over the value of sensor label. In this case the latter is always 1, so it’s safe to divide by it (I actually picked / and not * just in case it’s not 1. If it’s 0, that will break the graph instead of producing bogus values).
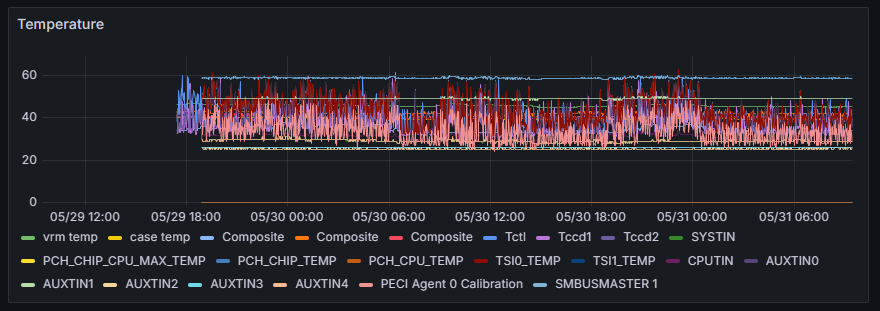
Altogether, this provides a neat way to monitor the temperatures inside my NAS (that SMBUSMASTER1 is sure hot!):